Text Visualization : Come and get inspired !!
Doing data viz on some types of tasks can be difficult, especially when ordinary line, bar or pie charts will not do enough job explaining the ideas we want to convey.
Text in particular, is a bit delicate to represent with the traditional techniques. Depending on the core idea we would like to represent, sometimes it turns out be be a much harder task.
The Theodore Psalter, AD 1066: Add MS 19352, f. 100r
I remember few situations when I attended a presentation, only to leave later with more confusion regarding the charts used.
I have talked many times on my Twitter about the importance of data viz, and how we really need to make sure that graphs are as simple and as clear as possible, containing easy to understand information, without confusion to your audience .
Yes I really do understand that this requires a certain patience and expertise, however why not get inspired and learn from people having done the task and try to understand the story behind the data, the goal and the objectives of such graphs?
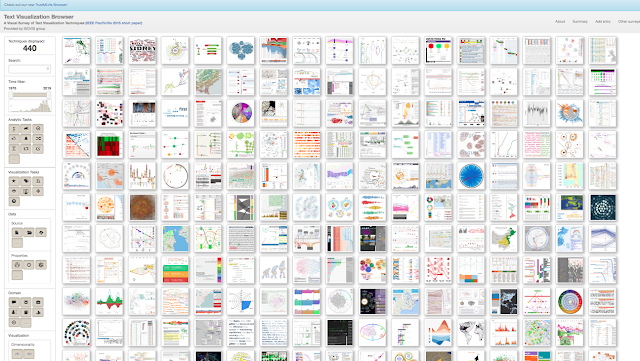
I stumbled upon a great resource that I wanted to share to the world, so here it is:
It is called the " Text Visualization Browser, A Visual Survey of Text Visualization Techniques"
I really enjoyed the contents, especially the papers associated with each data viz.
The good thing is, they have selected a few good papers, with really interesting topics, so it wont be an hard job to read the paper, understand the subject matter, and not jump directly to see the charts.
Read !
Learn!
Get inspired!
Apply!
Repeat !


