Posts

Showing posts from February, 2016

Economic Analysis of the Tunisian Economy: Weekly update and course requirement

Image
As I have mentioned before, I have started giving a workshop at the Higher School of Statistics and Data Analysis; The subject is the economic and statistical analysis of the Tunisian Economy. I share here this week's requirements. Hello Team, I hope you are getting excited to start working with the Data! Starting from this week, we will not have the usual presentations, as this methods seems to be a time-waster. I will look at each group's work individually and have a workshop-methodology in reviewing your work each week. (this does not mean that you are not required to present your work! I expect the same quality and format of presentations each week, and you all have to be present at the class and work on your data  and show me the problems you have if there are any)
Data Mining basic and advanced concepts - Part 2 : Describing Data

Image
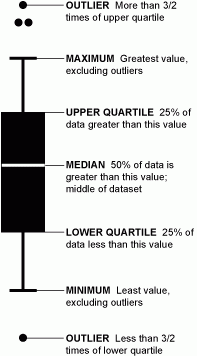
In this post I will talk a little bit about descriptive statistics, The first thing I usually look into is central tendency because it gives me an idea about the dispersion of the data. Central tendency answers a key questions: How Data is spread out? Calculating the numbers and putting them into a table is helpful, but the best way to make sense of these numbers is to put them in graphics! First we start by calculating the most important things: Mean, Median & Mode. I advise you to read the post about the Mean Median and Mode. The best way to understand data is to visualize it throw graphics. The best graphic to understand the central tendency of a data-set is the Box-Plot (see the Wikipedia Page ) . Box-plots are generally referred to as the first descriptive statistics visualization that any data analyst should plot in order to get the first feel of the data structure. Reading a Box-Plot I have found a very nice graphic in the Flowing Data website that I...

Intro to SAS Macro Programming (Part 2)

Image
We've seen a first introduction,  in part 1 of introduction to SAS macro programming . In this part we will try to see how to write a complete macro statement and how to use multiple variables in a single macro statement. Adding parameters to a SAS macro statement: Syntaxe: % Macro_name (Value_1,……., Value_n ); Example 1: In the example bellow, we will add a single parameter to our SAS macro that calculates basic descriptive statistics using proc means: In this case, the parameter will be the table name: %Macro AVG (Table); Proc means data =&table; run; %mend ; And now we will see the result of our macro:   %AVG (SASHELP.Shoes); This is the output we get from the macro we've just created and executed :