7 Charts That Lied to Your Face: Why Bad Data Visualization Is the Class My Students Never Miss

For the past few years, I have been teaching data visualization to data science students at Université Paris Cité at the IUT de Paris — Rives de Seine. And while teaching Python coding is a relatively simple thing, I have decided to shift the course toward a more useful and pedagogical angle: how to make data speak, and how to make good charts, the correct way.
One of the chapters I spend around 25% of the course time on is bad data visualization: mistakes made with charts, misleading visual design, and how a graph can quietly manipulate the reader.
This is the part of the course where I get 100% attendance and around 97% active interaction from my students. Yes, I am a statistician, and I keep track of a lot of metrics. It is probably because this is the single course section where they are not required to open their computer, nor to work on a practical exercise.
I start the chapter by dimming the light of the room. I launch my slides. No explanation. No theory. No code. Just charts, infographics, maps, and visualizations for about 15 minutes.
Then I stop and ask them:
What did you notice?
At first, the room is quiet. Then one student says, almost carefully:
I think there is something wrong with one of the visualizations. It shows a pie chart, but the sum is more than 100%.
Another student adds:
The axis was weird in one chart. The line looked like it was going down, but maybe the values were going up.
Then another one:
The dates were not in order.
And suddenly, the room changes. They are no longer passive viewers of charts. They become investigators.
That is exactly the point of the exercise. Bad data visualization is not only about ugly charts. Some bad charts are beautiful. Some are clean. Some are professionally designed. The problem is deeper: a bad chart breaks the contract between data, visual encoding, and reader.
A good chart helps the reader see the structure of the data. A bad chart pushes the reader toward a conclusion that the data does not justify.
So let’s look at seven real examples of bad or misleading data visualization, and what each one teaches us.
1. The percentage chart that gave 120%

The first classic example is the chart that makes students immediately wake up: a percentage chart that adds up to more than 100%.
Fox News displayed a Rasmussen poll about whether scientists falsify research to support their theories on global warming. The graphic showed three numbers:
- 59% somewhat likely
- 35% very likely
- 26% not very likely
Together, these add up to 120%.
The issue was not just a small arithmetic mistake. The chart mixed categories incorrectly. The “somewhat likely” number appears to have been built by combining “very likely” and “somewhat likely,” then the “very likely” category was shown again separately. The “not very likely” category also appears to have combined two categories, while undecided respondents were omitted.
What is wrong?
Any chart showing parts of a whole assumes that the categories are mutually exclusive and that the total makes sense. If categories overlap, if some categories are counted twice, or if some respondents disappear, the chart is no longer a visualization. It is arithmetic theatre.
How to fix it
Use the original response categories:
- Very likely
- Somewhat likely
- Not very likely
- Not at all likely
- Not sure
If you combine categories, say exactly what you combined. For example: “likely” = “very likely” + “somewhat likely.”
2. The Reuters gun-death chart where up meant down

Image attribution: Reuters chart, reproduced in Live Science.
This one is famous in data visualization courses because the trick is simple but powerful.
A Reuters chart about gun deaths in Florida after the “Stand Your Ground” law used a vertical axis where higher numbers appeared lower on the chart. In other words, the y-axis was inverted.
At a glance, the chart looks like gun deaths fell after the law. But the numbers show the opposite: gun deaths increased.
What is wrong?
Most readers interpret “up” as “more” and “down” as “less.” When the axis is reversed without making that design choice impossible to miss, the visual message becomes the opposite of the data message.
The viewer sees a decline. The data shows an increase.
How to fix it
Use the conventional y-axis direction: low values at the bottom, high values at the top. If you have a very strong reason to invert an axis, label it aggressively and explain why. But for public communication, especially on sensitive topics, avoid reversing basic visual conventions.
3. The Georgia COVID chart where time was not time anymore
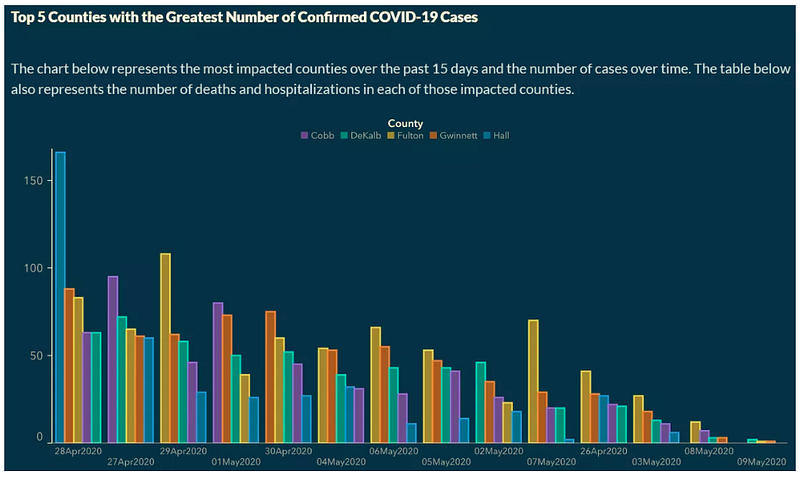
Image attribution: Georgia Department of Public Health graphic, reproduced by the Sabin Center for Climate Change Law, Columbia Law School. The same chart is also discussed by Vox.
During the COVID-19 pandemic, a graph from the Georgia Department of Public Health appeared to show a decline in confirmed cases across several counties.
The issue was the x-axis: dates were not placed in chronological order. Higher values were clustered on the left, and lower values were pushed to the right, regardless of the actual date.
What is wrong?
A time-series chart has one sacred rule: time must behave like time.
If dates are on the x-axis, readers assume they are ordered chronologically. Breaking that assumption creates a false story. Here, the visual story was “cases are going down,” but the chart structure created that impression artificially.
How to fix it
Order dates chronologically. If you sort by value, do not use a time-series layout. Use a ranked bar chart and label it clearly as a ranking, not a temporal evolution.
4. The truncated bar chart that turned a small difference into drama

Image attribution: Datawrapper Academy.
This one is less spectacular, but it is everywhere: bar charts that do not start at zero.
Datawrapper explains that truncated y-axes in column and bar charts are deceptive because bars encode magnitude through length. When the baseline is cut, the visual difference between bars becomes much larger than the actual numerical difference.
What is wrong?
A bar is not just a point. It is a filled shape whose length is interpreted from zero. If the chart starts at 50 instead of 0, a moderate difference can look like a massive gap.
This is not always intentional. Sometimes the designer just wants to make the difference visible. But the result can still be misleading.
How to fix it
For bar charts, start at zero.
If you need to show small differences, use a dot plot, a line chart, or a difference chart. These alternatives allow the reader to see variation without visually exaggerating magnitude.
5. The bubble chart where circle sizes did not match the data

Image attribution: Randy Krum / Cool Infographics, reproduced and discussed by PolicyViz. The original design was published by Vox.
Bubble charts are dangerous because people are not very good at comparing areas. They become even more dangerous when the areas are not proportional to the values.
PolicyViz discussed a Vox infographic about donations versus diseases that kill people. The issue was that the circle sizes did not match the displayed values. Smaller amounts and smaller death counts were visually exaggerated.
What is wrong?
If you encode data using circle area, the area must be proportional to the value, not the diameter.
If you map values directly to diameter, the area grows too fast. The visual difference becomes much larger than the numerical difference.
There is also a second issue: even when the areas are mathematically correct, readers still struggle to compare bubbles precisely.
How to fix it
Use a bar chart when accurate comparison matters.
If you use bubbles, calculate the areas correctly and accept that the chart is better for rough magnitude than precise comparison.
6. The pictogram that made 8 cases look like a public health disaster
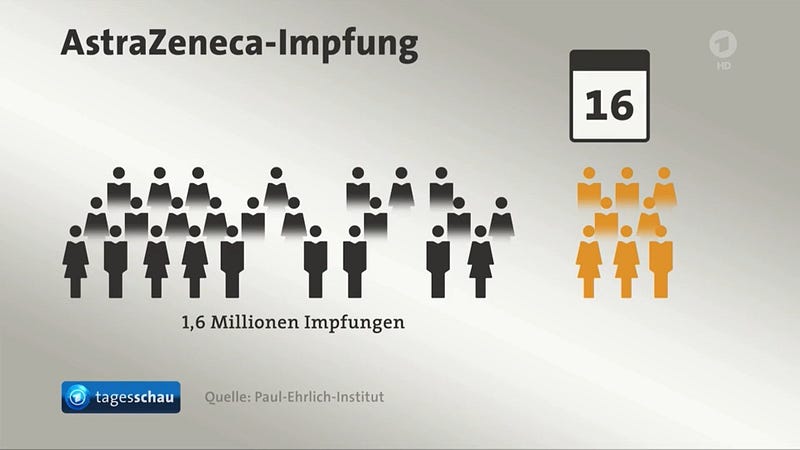
Image attribution: German TV graphic, source noted as @FabianHabersack in the European Data Visualisation Guide.
This example is painfully effective.
A German TV graphic was meant to show that out of 1.6 million AstraZeneca vaccinations, 8 people were affected by blood clots in cerebral veins. But the visual used 33 human icons, 8 of which represented the blood clot cases.
Visually, that looks like almost one quarter of vaccinated people developed blood clots. Numerically, the rate was around 0.00005%.
What is wrong?
The chart used icons as if they represented equal units, but the units were not proportional. This is especially dangerous in public health communication because the emotional reaction to the image can be much stronger than the numerical message.
The chart does not just distort magnitude. It distorts fear.
How to fix it
When using pictograms, make sure each icon represents the same number of people.
For rare events, show the denominator directly. You can use one highlighted dot among a large field of dots, or state the rate per million. The key is that the visual proportion must respect the numerical proportion.
7. The election map where land voted louder than people
Image attribution: Screenshot/GIF from Maps Mania, discussing Engaging Data’s US County Electoral Map — Land Area vs Population. Maps Mania post: Land doesn’t vote, people do!
Election maps are among the most shared, and most misunderstood, visualizations.
A standard county-level choropleth map colors geographic areas according to the winning party. The problem is that land area dominates the viewer’s perception. Large rural counties occupy huge visual space, while dense urban counties may appear tiny even if they contain many more voters.
The result is a map that answers a geographic question but is often interpreted as a population question.
What is wrong?
The map shows where land is red or blue. It does not directly show how many people voted red or blue.
This is not necessarily a lie if the chart is correctly described. But it becomes misleading when readers interpret land area as population weight.
How to fix it
Use cartograms, dot-density maps, proportional symbols, or population-weighted maps.
And always explain what the map shows: land area, population, votes, districts, or electoral power. A map is never neutral. It always encodes a choice.
The real lesson: bad charts are not just bad design
After showing these examples, I usually ask students one final question:
Which one is the worst chart?
They often start by choosing the most visually ugly one. Then they change their mind.
The worst chart is not always the ugliest. The worst chart is the one that makes a false conclusion feel obvious.
That is why teaching bad data visualization is so useful. It trains students to stop trusting charts automatically. It teaches them to ask:
- What is the source?
- Are the categories correct?
- Are the axes honest?
- Is time ordered correctly?
- Are areas, icons, and colors proportional to the data?
- Is the chart showing the full context or only the convenient part?
- What conclusion does the chart push me toward?
A good visualization does not simply look professional. It respects the data, respects the reader, and makes the reasoning visible.
A bad visualization does the opposite. It hides assumptions. It exaggerates differences. It manipulates perception. Sometimes it does this intentionally. Sometimes it does it by accident. But in both cases, the result is the same: the reader walks away believing something the data did not really say.
This is why I spend so much time on bad data visualization in class. Before students learn how to make beautiful charts, they need to learn how charts can lie.
Because once you have seen the trick, you start seeing it everywhere.
Sources and image credits
- Mediaite, “When 120% Makes Sense: Fox & Friends Defends Poll Display”: https://www.mediaite.com/media/tv/when-120-makes-sense-fox-friends-defends-poll-display/
- Media Matters, “A History of Dishonest Fox Charts”: https://www.mediamatters.org/fox-friends/history-dishonest-fox-charts
- Live Science, “Misleading Gun-Death Chart Draws Fire”: https://www.livescience.com/45083-misleading-gun-death-chart.html
- Sabin Center for Climate Change Law, “COVID-19 Data Misrepresented by Georgia Health Department”: https://climate.law.columbia.edu/content/covid-19-data-misrepresented-georgia-health-department
- Vox, “Georgia’s Covid-19 cases aren’t declining quickly, contrary to early data”: https://www.vox.com/covid-19-coronavirus-us-response-trump/2020/5/18/21262265/georgia-covid-19-cases-declining-reopening
- Datawrapper Academy, “Why our column and bar charts start at zero”: https://www.datawrapper.de/academy/why-our-column-and-bar-charts-start-at-zero
- PolicyViz, “Donations vs. Disease”: https://policyviz.com/hmv_post/donations-vs-disease/
- European Data Visualisation Guide, “Respecting proportions”: https://data.europa.eu/apps/data-visualisation-guide/respecting-proportions
- Engaging Data, “US County Electoral Map — Land Area vs Population”: https://engaging-data.com/county-electoral-map-land-vs-population/
- Maps Mania, “Land doesn’t vote, people do!”: https://googlemapsmania.blogspot.com/2024/09/land-doesnt-vote-people-do.html


