Posts

Showing posts with the label Statistics

Capitaliser sur la "Richesse" de vos données [Partie 1/4]

Image
Les technologies de Big Data, de l'analyse de données et des modèles prédictifs sont devenues maintenant les "must-have" de toutes les entreprises dans le monde. Les CEO et directeurs observent avec admiration comment Google, Facebook, Airbnb et d'autres sociétés sont entrain de révolutionner leur domaines avec les algorithmes d'intelligence artificielle ,de machine learning et du "Deep Learning".

Business Intelligence en Tunisie: Ces Jeunes Ingénieurs qui innovent

Image

I was on Tv, and It was Awesome! (talking about data, statistics and economics)

Image
So I have been on the panel of the Tv show Called " The Expert ", aired on  Tounesna Tv. The show is mainly a show about the economy worldwide, but it talks about the Tunisian economy and the main events that happened in the financial world.

Advanced (Intro) to SAS Macro Programming (Part 3)

Image
The First part and the Second part of this introduction talked about some basic things every beginner  needs to know when using SAS Macro Language. In this part we will talk about : Dynamically storing a value into a macro variable Iterative statements in macro language (Next part) Conditional statements in macro language  (Next part) 1-Dynamically storing a value into a macro variable /* Calculating an average value and storing it in a macro variable*/ Proc Means Data = SASHELP.heart noprint; Var height; Output out = test mean= avg_height; Run ;

Economic Analysis of the Tunisian Economy: Weekly update and course requirement

Image
As I have mentioned before, I have started giving a workshop at the Higher School of Statistics and Data Analysis; The subject is the economic and statistical analysis of the Tunisian Economy. I share here this week's requirements. Hello Team, I hope you are getting excited to start working with the Data! Starting from this week, we will not have the usual presentations, as this methods seems to be a time-waster. I will look at each group's work individually and have a workshop-methodology in reviewing your work each week. (this does not mean that you are not required to present your work! I expect the same quality and format of presentations each week, and you all have to be present at the class and work on your data  and show me the problems you have if there are any)

Data Mining basic and advanced concepts - Part 2 : Describing Data

Image
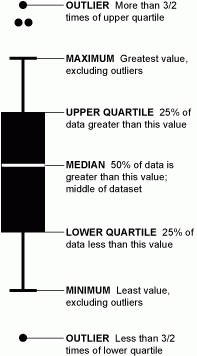
In this post I will talk a little bit about descriptive statistics, The first thing I usually look into is central tendency because it gives me an idea about the dispersion of the data. Central tendency answers a key questions: How Data is spread out? Calculating the numbers and putting them into a table is helpful, but the best way to make sense of these numbers is to put them in graphics! First we start by calculating the most important things: Mean, Median & Mode. I advise you to read the post about the Mean Median and Mode. The best way to understand data is to visualize it throw graphics. The best graphic to understand the central tendency of a data-set is the Box-Plot (see the Wikipedia Page ) . Box-plots are generally referred to as the first descriptive statistics visualization that any data analyst should plot in order to get the first feel of the data structure. Reading a Box-Plot I have found a very nice graphic in the Flowing Data website that I...

Economical Analysis course: Overview- first weeks requirements

Image
Following the Statistical Analysis Software course I gave in the first semester of this year, I have started giving a couple of classes to freshman and sophomore statisticians . The first course is a statistical workshop during the second semester that will be focused on economical and statistical analysis of the Tunisian Economy.

The hard thing about hard things: Teaching experience Feedback

Image
Today was the last day of my Statistical Analysis Software course I gave at the Higher School of Statistics and Data Analysis of Tunis. The only thing that's left is the final exam, so the work is not over...Yet! It is important to mention that teaching is a -very- hard thing to do, especially if you are a "caring" person and you do CARE about perfection and small details. I have tried to be as reachable as possible to all my students, especially at the beginning of the class, when they were new and haven't had any significant statistical of computing background. A Summary of the points I have given in the class this semester Making everybody happy and all the course material easy is not the goal here. The most important thing is to make sure that all the details are delivered to all students and that all the questions they ask about the course are answered.

Data Mining basic and advanced concepts - Part 1 : Variables

Image
It is  important to get to know your data. It's very tempting to jump straight to analyzing and forecasting or building predictive or regression models. But Data needs to be ready for that! Real world data is typically noisy, imperfect and heterogeneous. So cleaning this data and getting familiar with its structure is a crucial task. Usually, this task of data cleaning is time-consuming. I would say from a personal experience that about 75 to 80 percent of the time spent with data is time dedicated to getting it ready in a shape suitable for analysis and model building.

September Talk: Higher School of Statistics and Data analysis

Image
Hello there! I have been invited this year by the Junior Enterprise of the Higher School of Statistics and Data Analysis to talk about my (little) experience as a statistician and former student of this school. As usual, the crowed was interesting, current students of the school were very interested in what I had to say.

Mathematical Symbols in LATEX

Image
I have been going through my hard drive and organizing some of the files I have, PDF's, eBooks and articles and I found a very interesting documents about LATEX math symbols. Please deactivate ad-blockers to be able to see the pdf document ! UPDATE : I have published this article a few years and it has attracted the most attention of all my blogposts, so I'd like to thank all of the visitors that shared this post. Please take some time to check out other articles I have shared about Data Science, Machine learning and Big Data: Data Mining basic and advanced concepts - Part 2 : Describing Data Here are some of the most interesting parts of it:

M&M&M : Mean ~ Median ~ Mode : Uncovered

Image
Is it just me , or people  are still confusing the 3 M's?   I've made a general observation about the common mistakes some folks make when talking about statistical concepts., that they can not differentiate between the mean, mode and median of a particular data variable. For statisticians and domain experts, this might seem like a "stupid" topic to talk about, since statistics are actually a very deep field, and those 3 points are just small dots in an ocean of concepts and knowledge . But it is very important for those who work with numbers, to really get the idea behind some of the basic concepts they see or use everyday, because as confusing as it might seem for some people, an argument where you use the "mean" as a variable to justify a decision you made will be totally wrong if what you were really referring to in your reasoning was the "Mode"