Quick distribution plotting with R
I was asked by new students in the Statistics and Data Analysis School of Tunis (and by others friends) about ways to plot densities and the best software to do that.
I will try to give some examples with R software on how to plot density .
If you don't know what R is, you can take a look at my old article that explains that very well with some good R learning resources . ( here in French ).
You know that densities are all about random data and the first thing that comes in mind is histograms.
To start this task, we will first set the data sample that we will work with which should be random, and then we will start plotting some nice graphics with the ggplot2 library.
Basic things :Histogram and density plots:
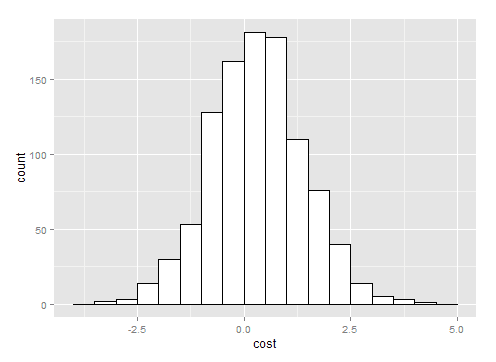 |
| regular histogram |
 |
| where is the mean! |
 |
| density plot |
 |
| Overlay of density and histogram |