2016

Dec 18, 2016

l'Analyse de données Publiques: Innovation et Croissance


Nous sommes tous connectés, nos informations personnelles sont collectées par plusieurs intervenant: les sites de réseaux sociaux, les opérateurs téléphoniques, les hôtels..etc

Ces données sont collectées et analysées à l'aide des nouvelles technologies innovantes.


Aug 25, 2016

Aug 21, 2016

I was on Tv, and It was Awesome! (talking about data, statistics and economics)


So I have been on the panel of the Tv show Called "The Expert", aired on Tounesna Tv.


The show is mainly a show about the economy worldwide, but it talks about the Tunisian economy and the main events that happened in the financial world.

Le Business Intelligence en Tunisie: Des ingénieurs qui innovent


Intelligence Economique et  Business Intelligence: définition

Collecter , organiser et structurer l'information stratégique  d'une entreprise sont des procédures indispensables aux développement et à la croissance de toute activité économique.


L’intelligence économique est l'opération de collecter de traiter d'analyse et de diffuser de l'information utile aux acteurs économiques et aux décideurs dans l'objectif de fournir une vision globale et stratégique de la société.

L'intelligence économique est souvent liées à l'innovation technologique et aux outils d'aide à la décision. D'où l’existence de l’informatique décisionnelle ou le Business Intelligence.

Le Business Intelligence est toute technologie ou outils et processus permettant aux entreprises de collecter, consolider, modéliser et restituer les données, matérielles ou immatérielles, en vue d'offrir une aide à la décision et de permettre à un décideur d’avoir une vue d’ensemble de l’activité traitée.


A quoi sert l’Intelligence Economique?

Face aux  défis de la mondialisation, la multiplication de la masse de l'information et la vitesse de sa circulation, et les crises et problèmes économiques aléatoires que personne ne peut prédire dans être informé, les entreprises sont entrain d'évoluer dans un environnement complexe et difficile à contrôler. Ainsi, l’intelligence économique se présente comme un outil efficace au service des décideurs qui veulent se protéger contre les aléas du marché et aussi qui veulent avoir une vision stratégique sur l'ensemble des activités de leur entreprise et du marché d'un façon générale.

L'intelligence économique sert à accomplir plusieurs objectifs à la fois:


Mar 27, 2016

When did Tunisia get the attention of the world?


It seems like Tunisia has entered a negative cycle of attacks and terrorism is not stopping anytime soon.

Following my analysis of the impact of the previous terrorist attack on the Bardo museum  in Tunisia, I have had some good feedback about the idea of the analysis. And after the unfortunate second terrorist attack on tourists in Sousse, I've wanted to explore the impact of this event as well.


In the mean time, ever sense I wrote the first draft for this post, there have been more then a lot of terrorist attacks in Tunisia and the situation in general is getting complicated.

Mar 26, 2016

Advanced (Intro) to SAS Macro Programming (Part 3)


The First part and the Second part of this introduction talked about some basic things every beginner  needs to know when using SAS Macro Language.

In this part we will talk about :

  1. Dynamically storing a value into a macro variable
  2. Iterative statements in macro language (Next part)
  3. Conditional statements in macro language (Next part)


1-Dynamically storing a value into a macro variable

/* Calculating an average value and storing it in a macro variable*/

Proc Means Data = SASHELP.heart noprint;
Var height;
Output out = test mean= avg_height;
Run;


Mar 7, 2016

You don't need big data, FOOL!


Ever since journalists started writing the words big & data together, with large letters and quotation marks, everyone who owns a computers and a couple of Excel spreadsheets think they have a big data or they are using big data in some sort of ways.

Working as a consultant means for me that my main role is to advise and help clients in understanding their needs. It also means that I should
guide them, explain and simplify complex algorithms and technologies that they hear about from the web.

Feb 22, 2016

Economic Analysis of the Tunisian Economy: Weekly update and course requirement


As I have mentioned before, I have started giving a workshop at the Higher School of Statistics and Data Analysis; The subject is the economic and statistical analysis of the Tunisian Economy.
I share here this week's requirements.


Hello Team,


I hope you are getting excited to start working with the Data!

Starting from this week, we will not have the usual presentations, as this methods seems to be a time-waster. I will look at each group's work individually and have a workshop-methodology in reviewing your work each week. (this does not mean that you are not required to present your work! I expect the same quality and format of presentations each week, and you all have to be present at the class and work on your data  and show me the problems you have if there are any)

Feb 18, 2016

Data Mining basic and advanced concepts - Part 2 : Describing Data


In this post I will talk a little bit about descriptive statistics, The first thing I usually look into is central tendency because it gives me an idea about the dispersion of the data.

Central tendency answers a key questions:

How Data is spread out?

Calculating the numbers and putting them into a table is helpful, but the best way to make sense of these numbers is to put them in graphics!

First we start by calculating the most important things: Mean, Median & Mode.

I advise you to read the post about the Mean Median and Mode.


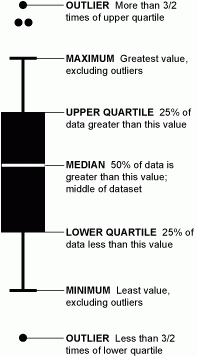
The best way to understand data is to visualize it throw graphics. The best graphic to understand the central tendency of a data-set is the Box-Plot (see the Wikipedia Page ) .
Box-plots are generally referred to as the first descriptive statistics visualization that any data analyst should plot in order to get the first feel of the data structure.


Reading a Box-Plot


I have found a very nice graphic in the Flowing Data website that I wanted to include here (link to the full post about box-plots)


Reading a Box-Plot (source: Flowing Data website)


Feb 17, 2016

Intro to SAS Macro Programming (Part 2)


We've seen a first introduction, in part 1 of introduction to SAS macro programming.

In this part we will try to see how to write a complete macro statement and how to use multiple variables in a single macro statement.

Adding parameters to a SAS macro statement:

Syntaxe:
%Macro_name (Value_1,…….,Value_n);

Example 1:

In the example bellow, we will add a single parameter to our SAS macro that calculates basic descriptive statistics using proc means:
In this case, the parameter will be the table name:

%Macro AVG (Table);
Proc means data =&table;
run;
%mend;

And now we will see the result of our macro:
 
%AVG(SASHELP.Shoes);

This is the output we get from the macro we've just created and executed :


Jan 24, 2016

Market Analysis and Customer Segmentation Using Machine Learning Algorithm: Course Overview


As I have mentioned in a previous post, I will be giving a couple of statistical workshops and courses at the Higher School of Statistics and Data Analysis of Tunis this year.


The second course I am giving is about Market Analysis and Customer Segmentation Using Machine Learning Algorithms. Bellow the project description and some details about the goal of the work we will do this year.

Jan 20, 2016

Economical Analysis course: Overview- first weeks requirements


Following the Statistical Analysis Software course I gave in the first semester of this year, I have started giving a couple of classes to freshman and sophomore statisticians .


The first course is a statistical workshop during the second semester that will be focused on economical and statistical analysis of the Tunisian Economy.